

Healthcare Technology · Independent Project
Healthcare Reporting & Analytics
A reporting and analytics project exploring how healthcare operational data can be organised into clearer performance metrics, reporting views and actionable insights.
- Reporting & Analytics
Overview
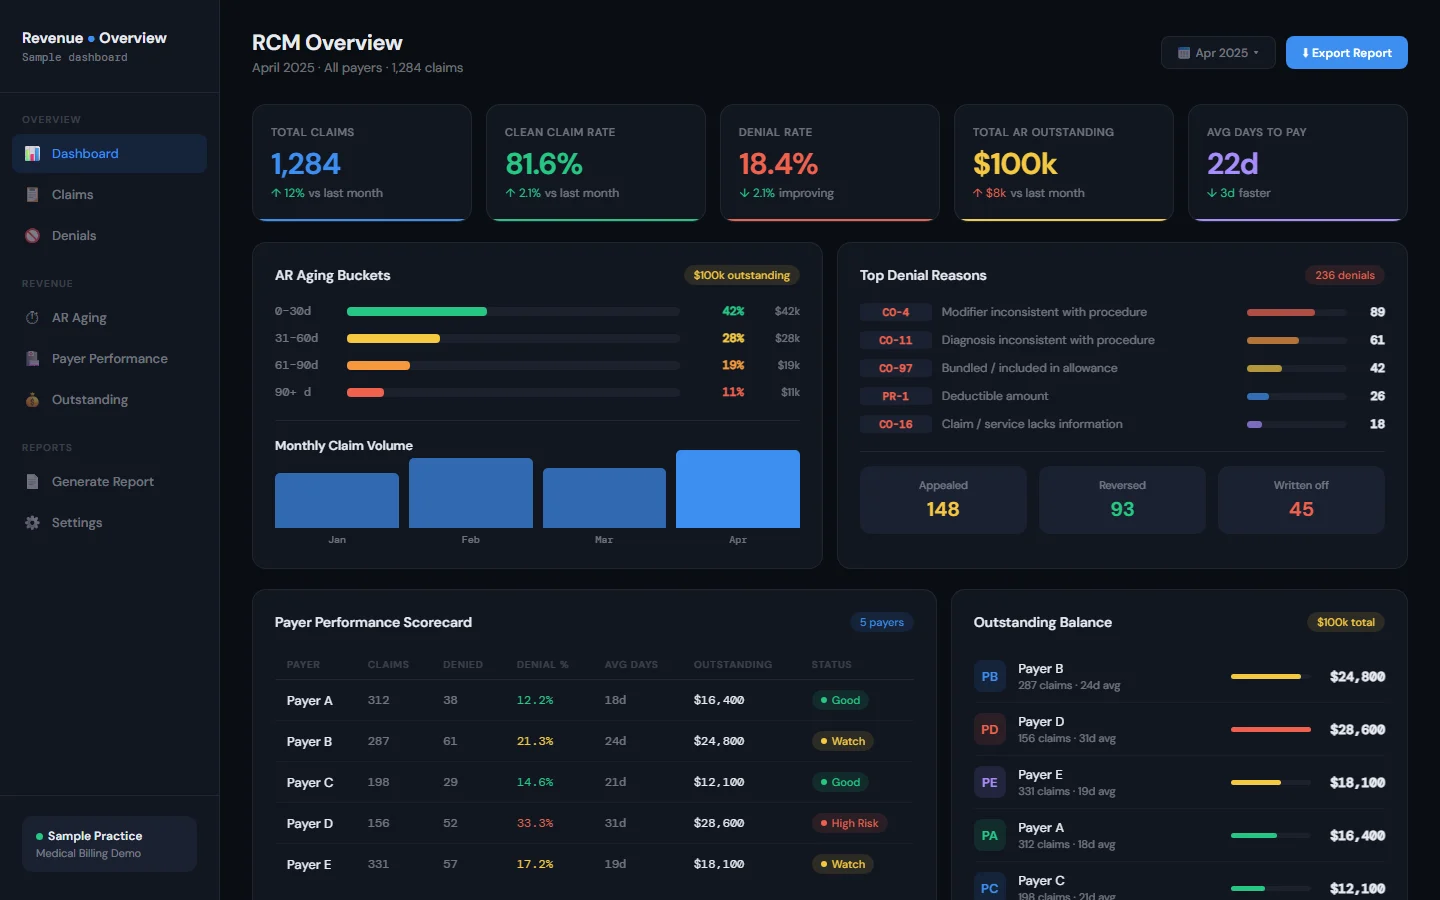
A browser-based revenue cycle dashboard that brings claims, denials, A/R and payer performance into a single overview.
The problem
Operational healthcare data usually lives in separate exports: claims in one place, denials in another, payer balances in a third. Seeing the whole picture means stitching them together by hand.
The solution
The dashboard reads a CSV export, matches its columns automatically and presents the key revenue cycle measures together, from clean claim rate to denial reasons and payer performance.
Features
- Overview of total claims, clean claim rate, denial rate, A/R outstanding and average days to pay
- A/R aging buckets and monthly claim volume
- Top denial reasons with their reason codes
- Payer performance scorecard and outstanding balance by payer
- CSV and TSV import with automatic column matching
- Runs entirely in the browser, with no data sent anywhere
Approach
Designed and tested only with synthetic data. No patient information or real claim records were used at any stage.
Have an idea? Let's make it happen.
Whether you need a digital solution, smarter workflows or practical technology training, let's start a conversation.